
Tableau
Tableau offers LEPs a way to create custom reports using Educare and non-Educare data.
Access
Log in: UNC ONYEN and password
Customization
Users can select:
- different years.
- different racial groups. Note that for the Pianta report, if you de-select “Missing” for racial group the report will show the data from 2021-22 onwards (when race was added to the parent survey).
- Educare children, non-Educare children, or all. If you only want to see Educare children, make sure to de-select the non-Educare children and missing.
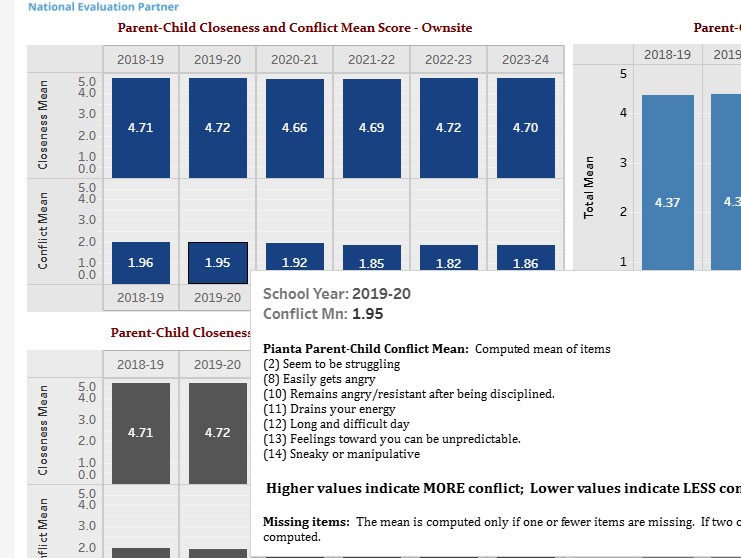
As the user hovers over a cell, additional information will appear (see example below):
In the video below, Keil Jones walks through an example of how to download your data from tableau and create a custom presentation in any Microsoft application.
Timing
The Tableau reports are based on the data that we have shared on SharePoint and are updated soon after new datasets are made available.
How to download the reports:
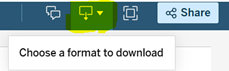
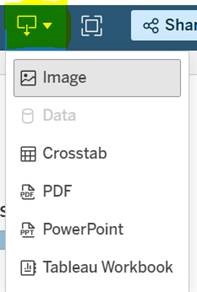
On the blue bar, near the upper righthand corner, there is a download button which will give you different options/format to choose from. Once you click on a specific format, the report will be saved under the downloads folder.
Downloading as a pdf or PowerPoint will produce static images of the graphs presented in Tableau. If you download as a Crosstab, it will produce an excel file with the data that you can then customize.
Below is a video from Keil Jones about exporting data from Tableau.
Questions
If you have any questions about tableau, please reach out to Nupur Mishra (nupur.mishra@unc.edu) and Keil Jones (keil.jones@unc.edu)

On each report page, there is an icon in the top right of the page that explains the toolbar and other ways of interacting with the reports. This page can also be found by navigating to the “i” tab from the line of tabs in top left when viewing a report.
Staff Survey Data
LEPs can use Tableau to look at Staff Survey frequencies and means across years and for different staff types, specifically:
- work environment (Collaboration, Supportive, Safe) for own site and other sites
- Health for own site and other sites
Tableau access link: https://tableau.unc.edu/#/site/fpg/workbooks/8407?:origin=card_share_link
Spring Parent Survey Data
LEPs can use Tableau to look at Spring Parent Survey frequencies and means for the Network across years and for different racial groups, specifically:
- Network-wide responses to the questions about the age of children ready for conversations about culture and discrimination
- Pianta Relationship scores for your school(s), the other sites, and all sites
Tableau access link: https://tableau.unc.edu/#/site/fpg/workbooks/7692?:origin=card_share_link
Fall Parent Interview Data
LEPs can use Tableau to look at Fall Parent Interview frequencies, means, and scores for the Network across years and for different racial groups and languages, specifically:
- Parent ratings of their resilience
- Parents’ perceived stress
- Reports of food insufficiency, food insecurity, and homelessness
- Financial Security score
Tableau access link: https://tableau.unc.edu/#/site/fpg/workbooks/9069?:origin=card_share_link